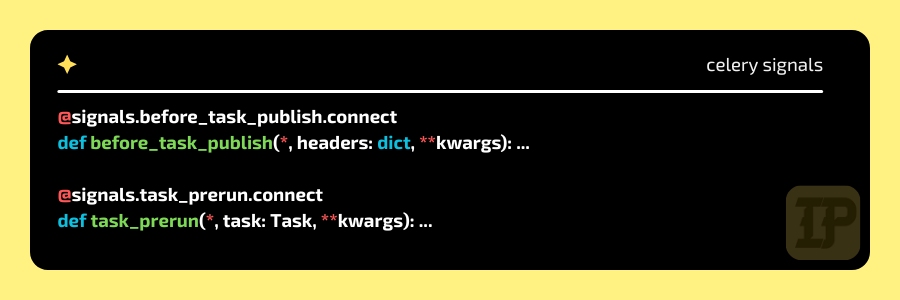
The next item in my collection of “Aren’t we all just constantly re-creating the same bits of code?” is how to track the execution time of Celery tasks.
Firstly, it could be argued that there are 2 different “exec” times for every Celery task:
- the real execution time - the time when the code was running
- the “time to done”-execution time - which includes the time spent in the queue waiting for a free worker
The reason both are important is: that our real motivation is understanding when the thing is done.

We trigger a task, we want to know when that job is done and when to expect the results.
It’s like project estimation. The manager truly wants to know when the project will be out of the house and not really, that it can be done in 1 week, but nobody is free to do it for the next 6 months. 👷♀️
In this post
Signals 🎺
As far as I can see, we just need to time the tasks ourselves. Our weapon of choice are Celery signals.
Hint 1: Celery signals get all their arguments as keyword arguments. This means that we can just type out the kwargs we are interested in and pack the rest into **kwargs.
Also: This is the best thing ever. All signals all over the world should adopt this practice!!
Hint 2: We can store the exec start and end times on the task object itself among the other attributes, which are called “headers”.
Start of queuing
Just as a new Celery task is put into a queue, let’s record the current time like so:
from celery import signals
from dateutil.parser import isoparse
from datetime import datetime, timezone

@signals.before_task_publish.connect
def before_task_publish(*, headers: dict, **kwargs):
    raw_eta: str | None = headers.get("eta")
    if raw_eta:
        # the task is scheduled for later, so, let's start the countdown from then
        publish_time = isoparse(raw_eta)
    else:
        publish_time = datetime.now(tz=timezone.utc).isoformat()
    headers["__publish_time"] = publish_time.isoformat()
Start of execution
When the task is picked up by a worker, let’s record the current time like so:
from celery import signals
from datetime import datetime, timezone

@signals.task_prerun.connect
def task_prerun(*, task: Task, **kwargs):
    setattr(task.request, "__prerun_time", datetime.now(tz=timezone.utc).isoformat())
End of execution
When the task is done, we can calculate both exec times and store them .. somewhere. Probably in StatsD or some other monitoring tool.
StatsD is an industry-standard technology stack for monitoring applications and instrumenting any piece of software to deliver custom metrics.
- Netdata: Introduction to StatsD [1]
from celery import signals, Task
from dateutil.parser import isoparse
from datetime import datetime, timezone, timedelta

@signals.task_postrun.connect
def task_postrun(*, task: Task, **kwargs):
    now = datetime.now(tz=timezone.utc)

    publish_time: datetime | None
    try:
        publish_time = isoparse(getattr(task.request, "__publish_time", ""))
    except Exception:
        publish_time = None

    prerun_time: datetime | None
    try:
        prerun_time = isoparse(getattr(task.request, "__prerun_time", ""))
    except Exception:
        prerun_time = None

    exec_time: timedelta = now - prerun_time if prerun_time else timedelta(0)
    waiting_time: timedelta = prerun_time - publish_time if publish_time and prerun_time else timedelta(0)
    waiting_and_exec_time: timedelta = now - publish_time if publish_time else timedelta(0)

    stats = {
        "exec_time_ms": to_milliseconds(exec_time),
        "waiting_time_ms": to_milliseconds(waiting_time),
        "waiting_and_exec_time_ms": to_milliseconds(waiting_and_exec_time),
    }
    # TODO: log somehow to somewhere ¯\_(ツ)_/¯
    statsd.timing(f"celery.task.exec_time_ms", ..., tags=[f"task:{task.name}"])
    statsd.timing(....
Bonus: And once you are tracking how long tasks take, you can set up alerts for when they take too long. 🛎️
It can be as simple as adding a hard coded threshold to the above function:
if exec_time > timedelta(hours=1):
  logger.error(f"Task {task.name} took too long: {exec_time}. Check it out!")
Or you can have layers of thresholds or thresholds as settings on the task definitions or whatever you can express in code.